Home
 Kentucky: By The Numbers
Kentucky: By The Numbers is a Cooperative Extension program in the
Department of Community and Leadership Development at the University of Kentucky.
Primarily known for the data series by the same name, the program also provides publications and other resources for those interested in finding data on their county or learning more about rural areas.
________________________________________________________________________________________________________
Recent Updates
Secondary Data for the Statewide Community Needs Assessment

Four issues of Kentucky: By The Numbers were created to provide secondary data that correspond to the issues covered in the Cooperative Extension Statewide Community Needs Assessment. The secondary data were compiled to assist in using the survey results for local planning. The needs assessment survey was conducted to identify and prioritize community needs, issues, and/or opportunities that Extension could address through targeted educational programming and engagement efforts.
Aging Data Series:
Aging 2003 Population Estimates
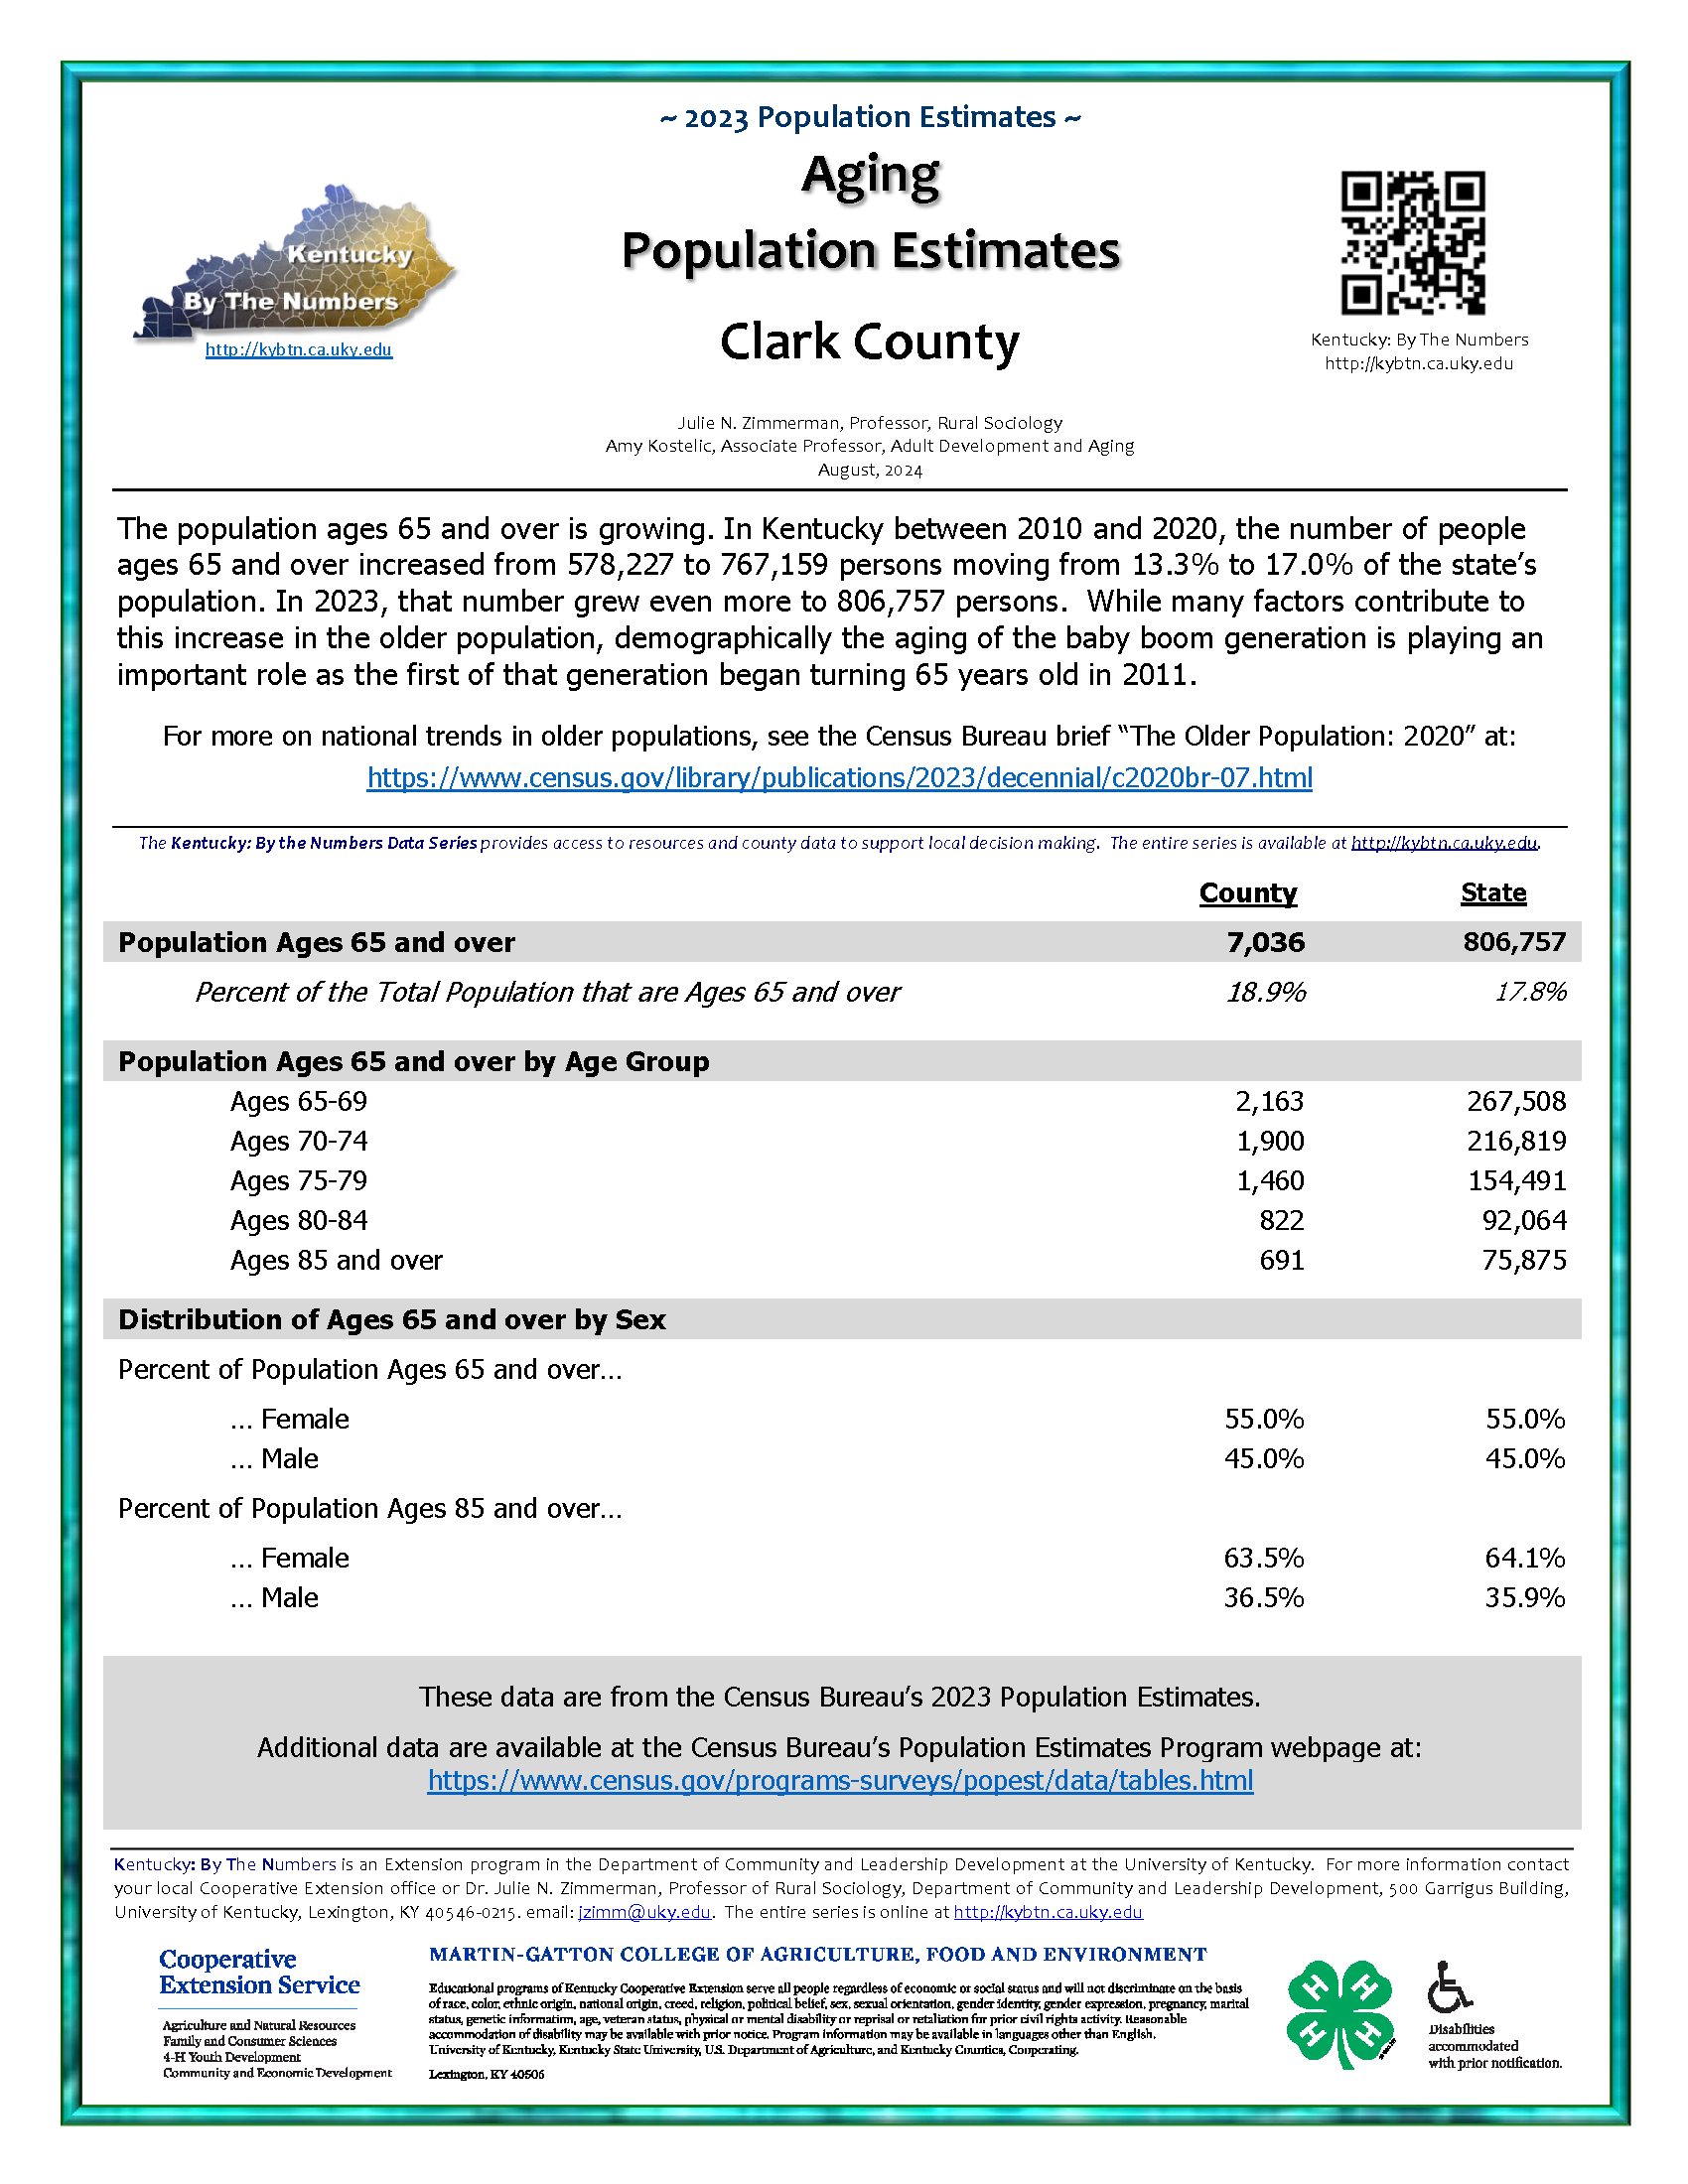
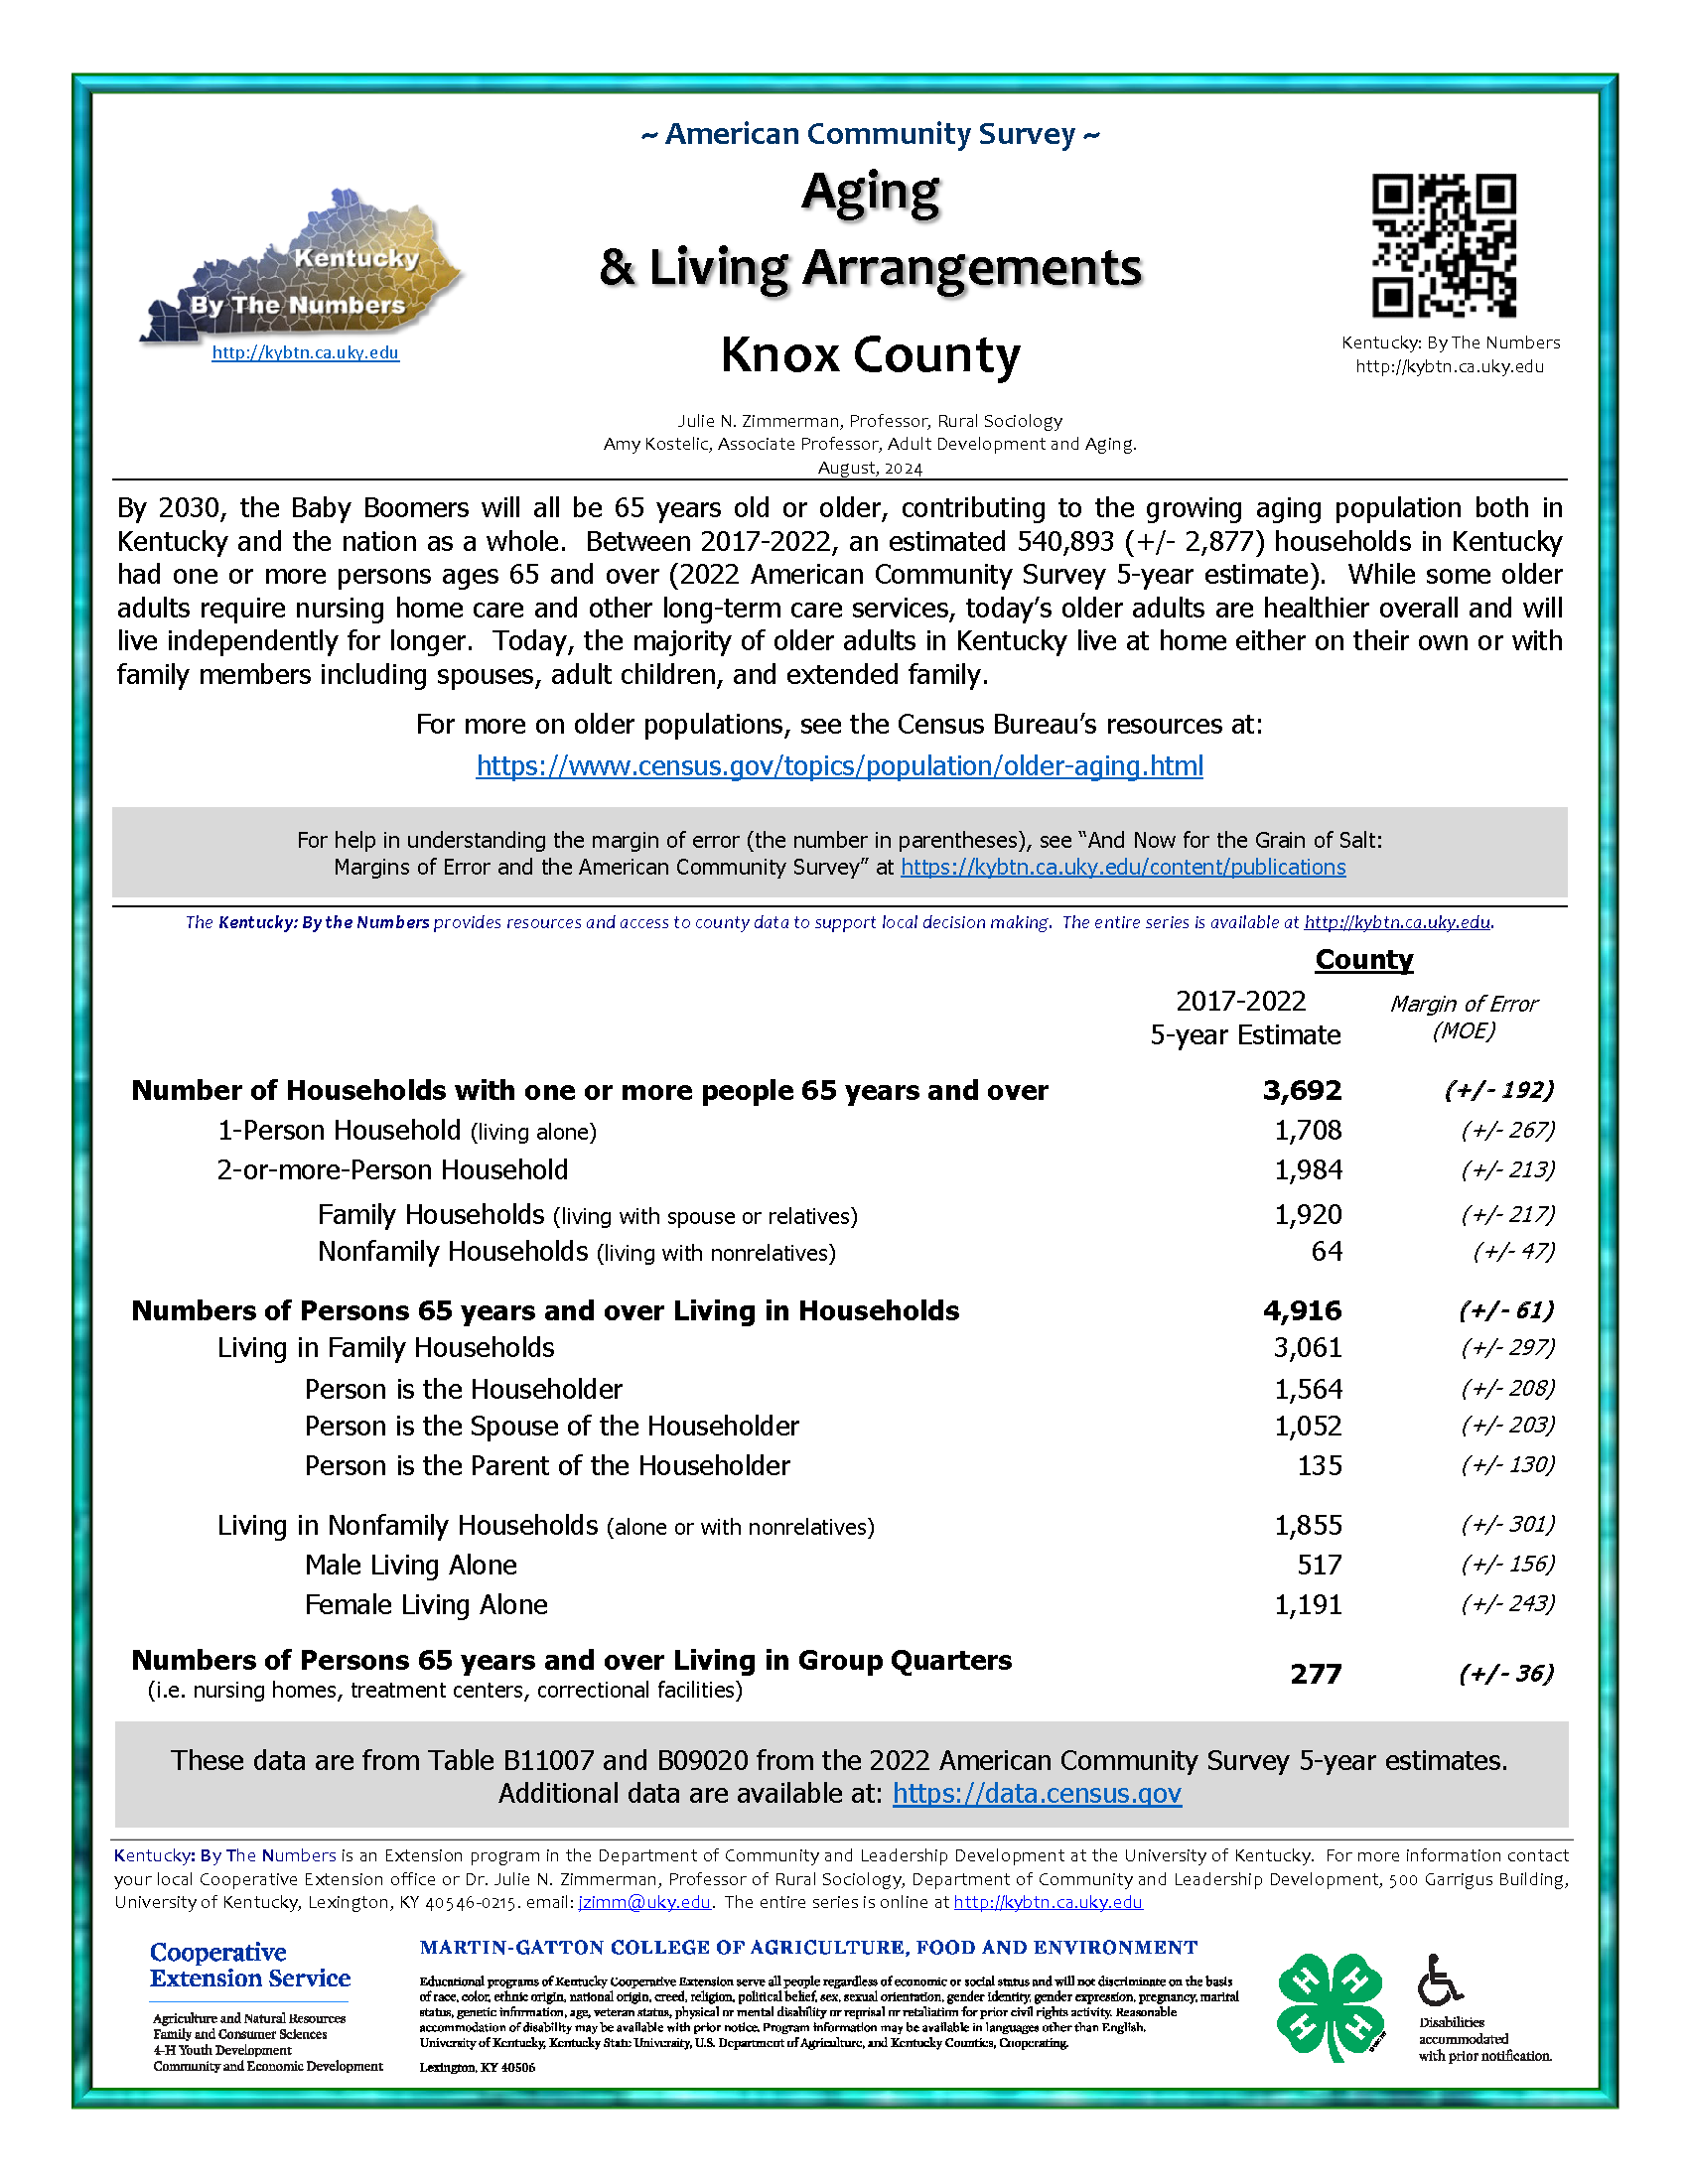 By 2030, the Baby Boomers will all be 65 years old or older, contributing to the growing aging population both in Kentucky and the nation as a whole. Between 2017-2022, an estimated 540,893 (+/- 2,877) households in Kentucky had one or more persons ages 65 and over (2022 American Community Survey 5-year estimate). While some older adults require nursing home care and other long-term care services, today’s older adults are healthier overall and will live independently for longer. Today, the majority of older adults in Kentucky live at home either on their own or with family members including spouses, adult children, and extended family.
Grandparents Living with Grandchildren
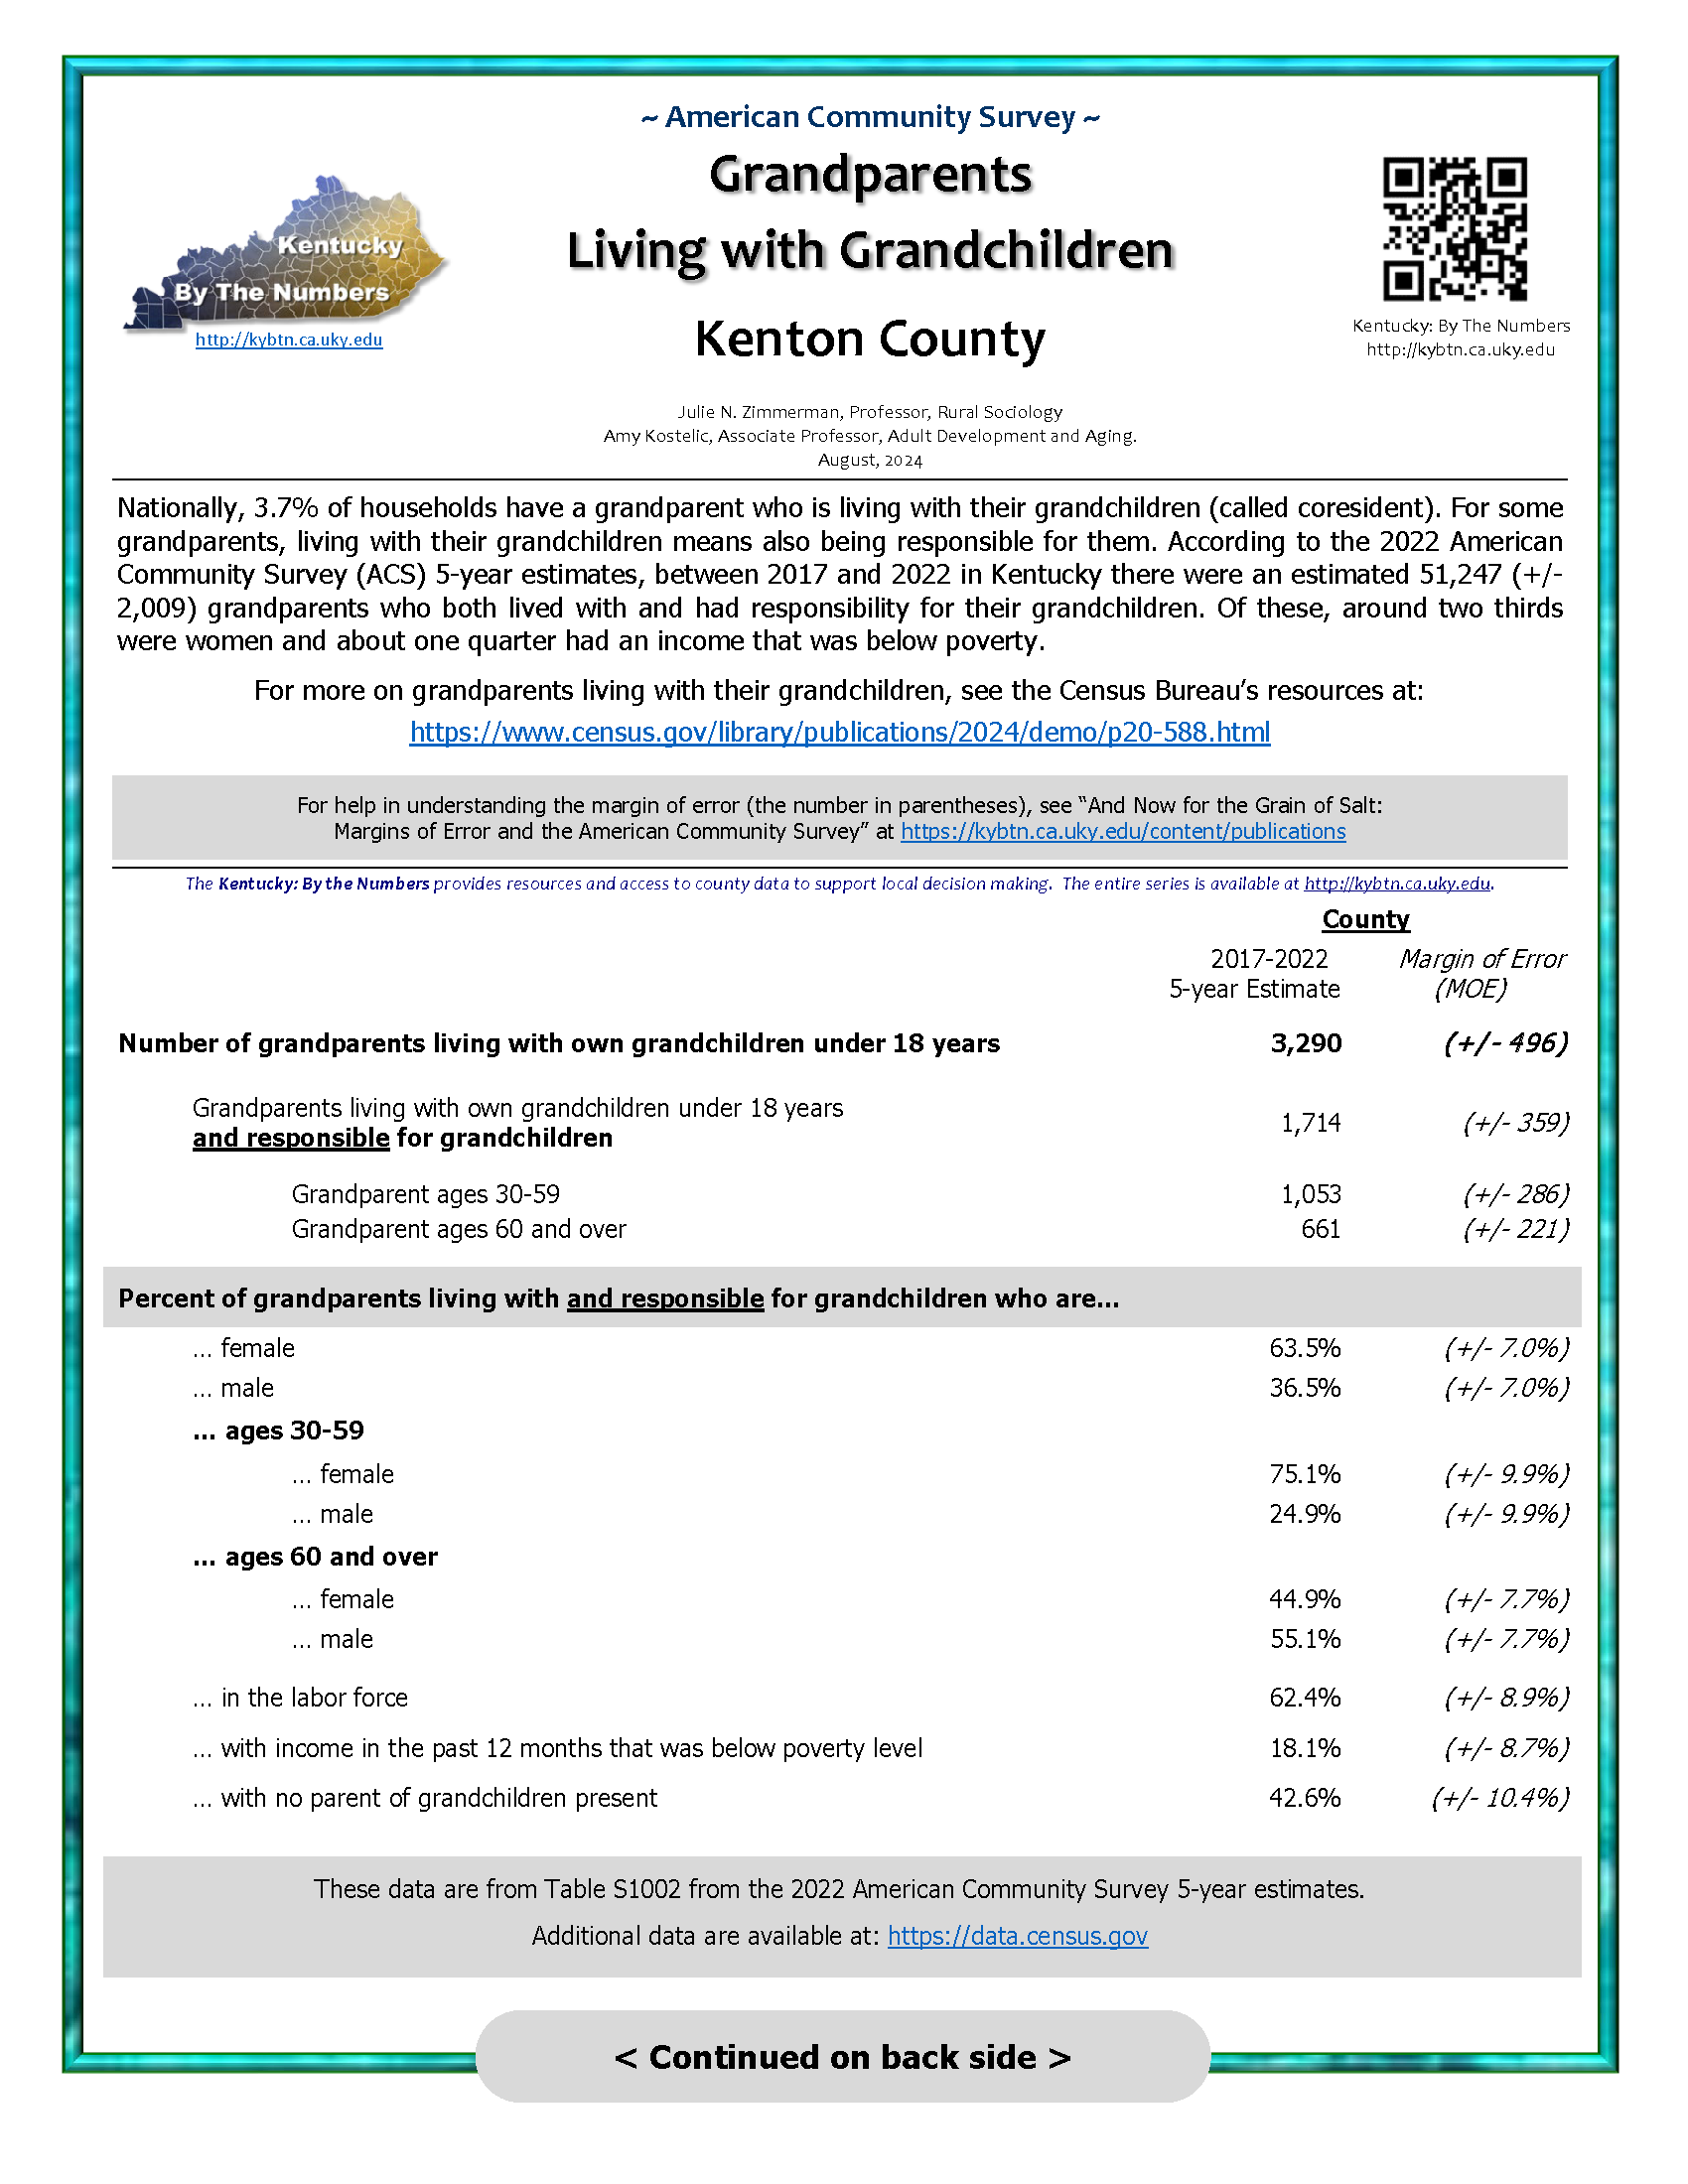
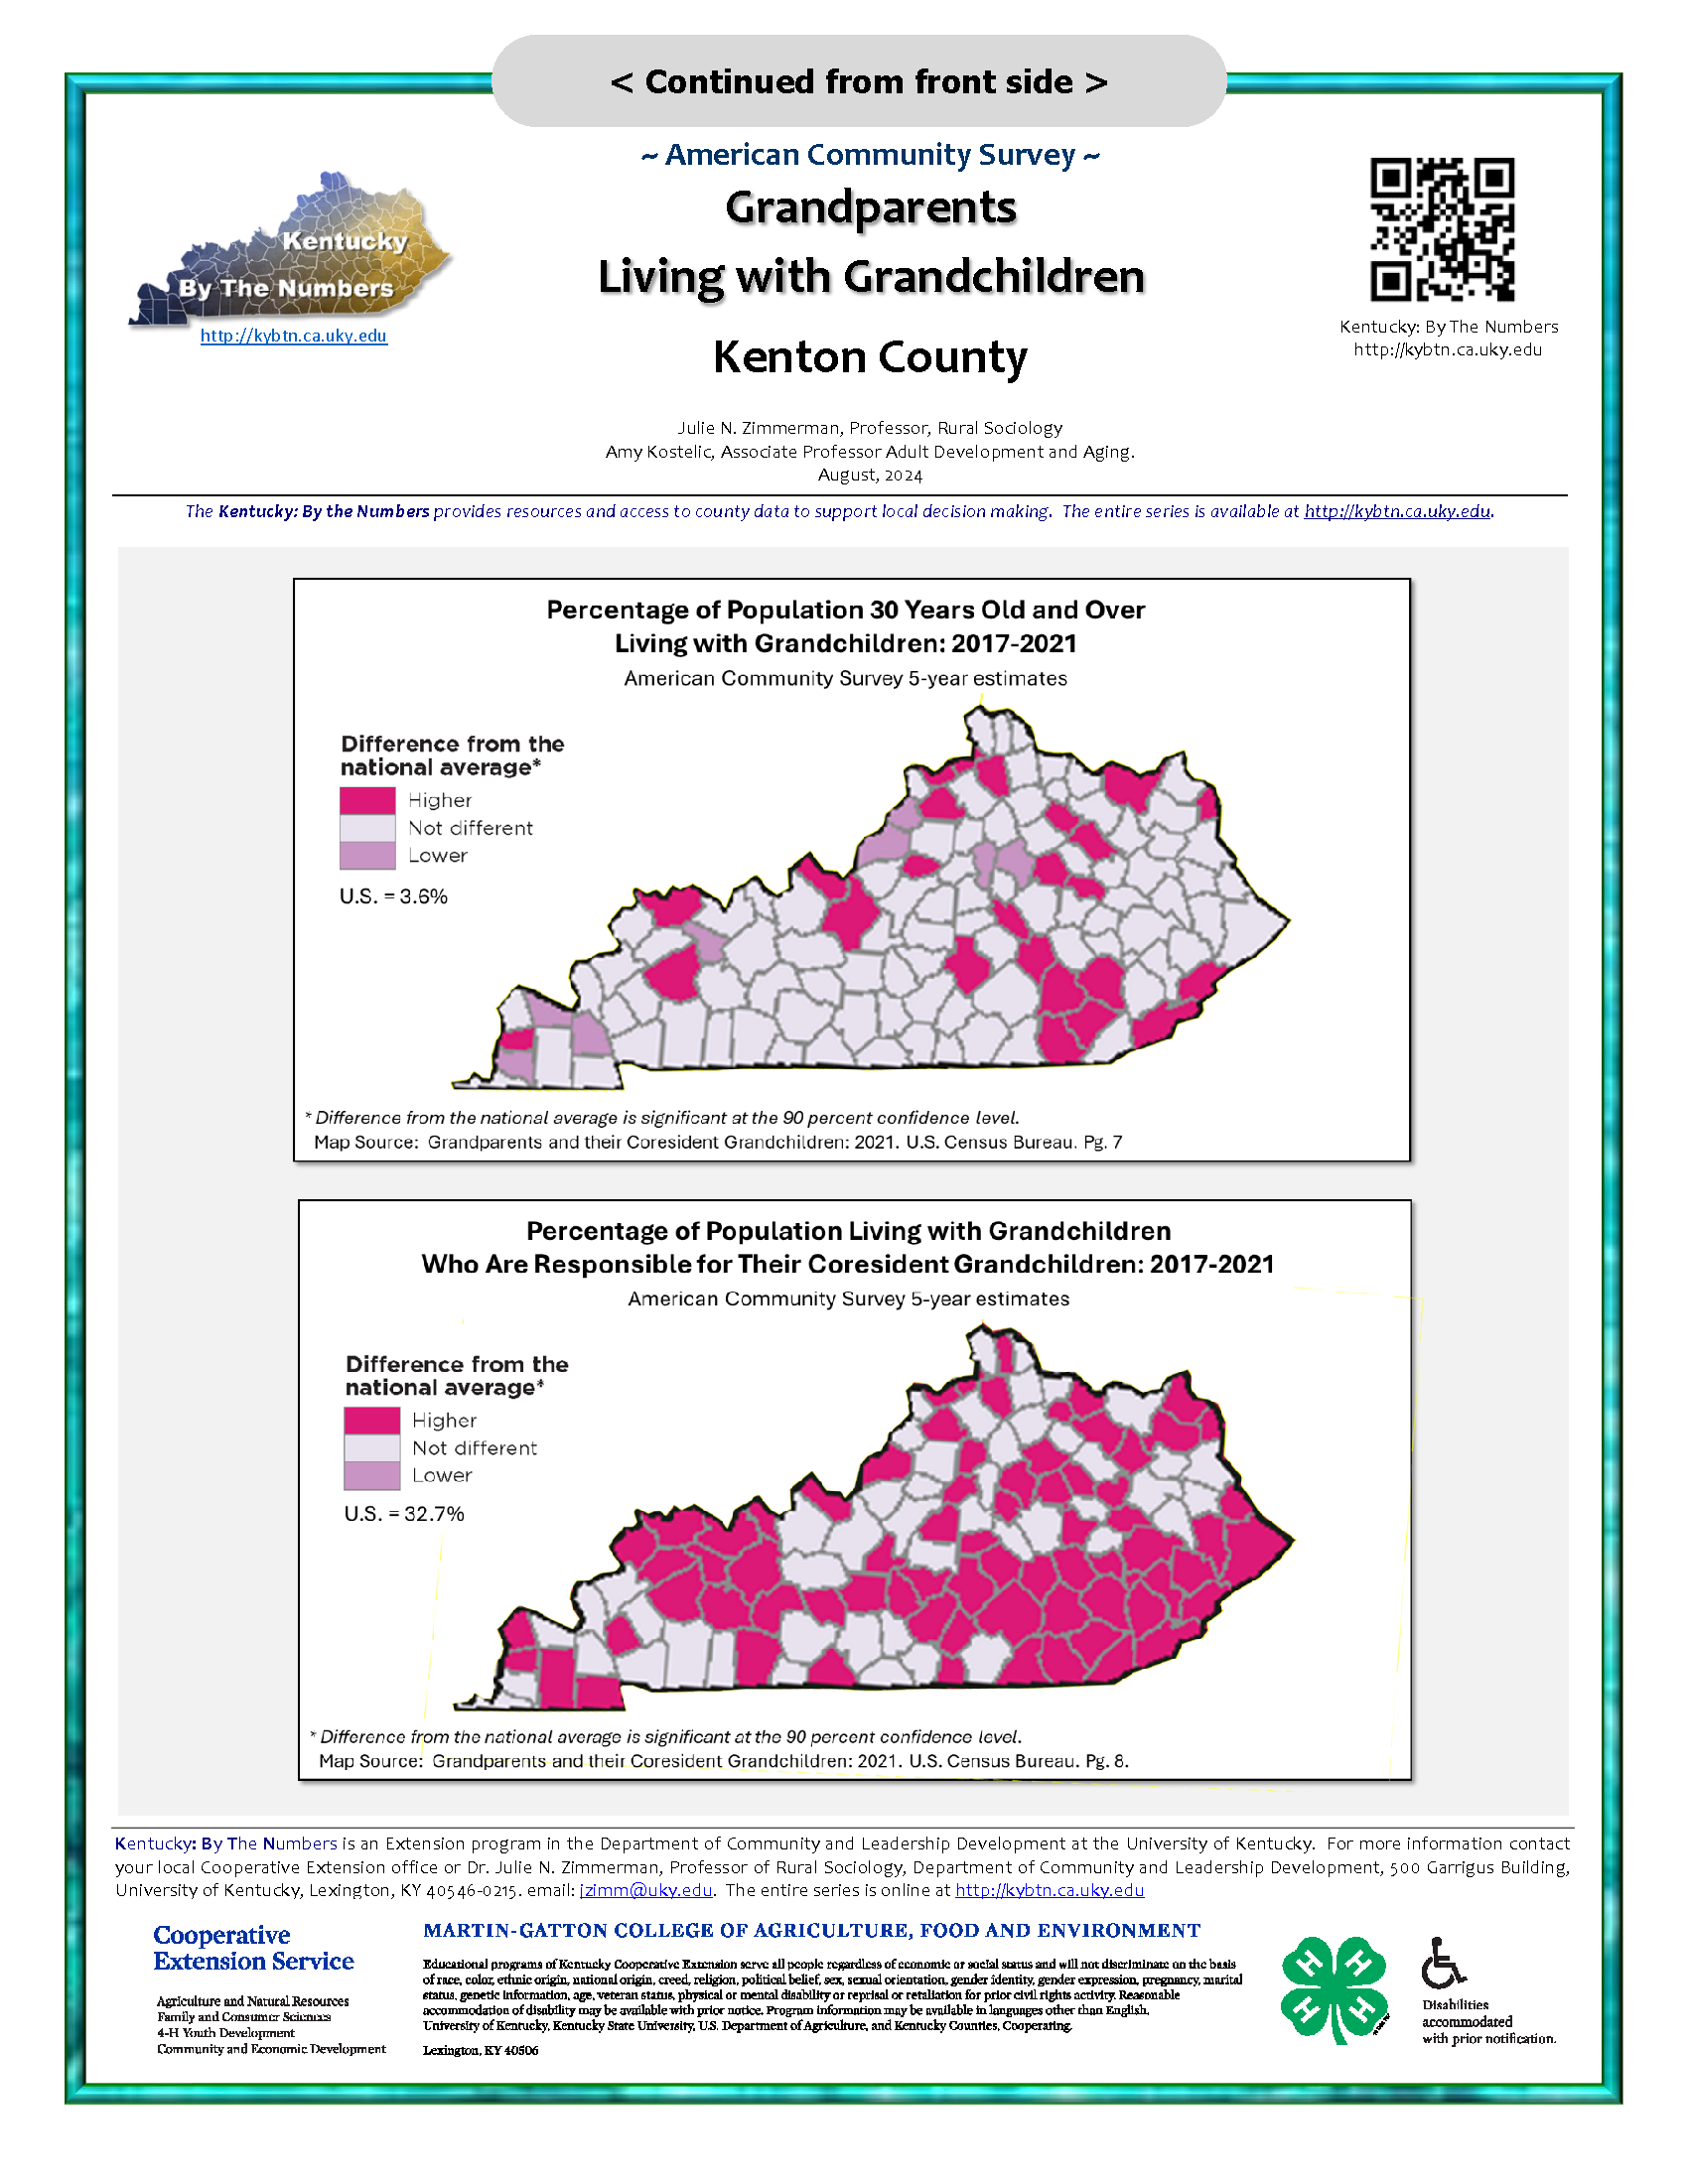 Nationally, 3.7% of households have a grandparent who is living with their grandchildren (called coresident). For some grandparents, living with their grandchildren means also being responsible for them. According to the 2022 American Community Survey (ACS) 5-year estimates, between 2017 and 2022 in Kentucky there were an estimated 51,247 (+/- 2,009) grandparents who both lived with and had responsibility for their grandchildren. Of these, around two thirds were women and about one quarter had an income that was below poverty.
2022 Agriculture Profile
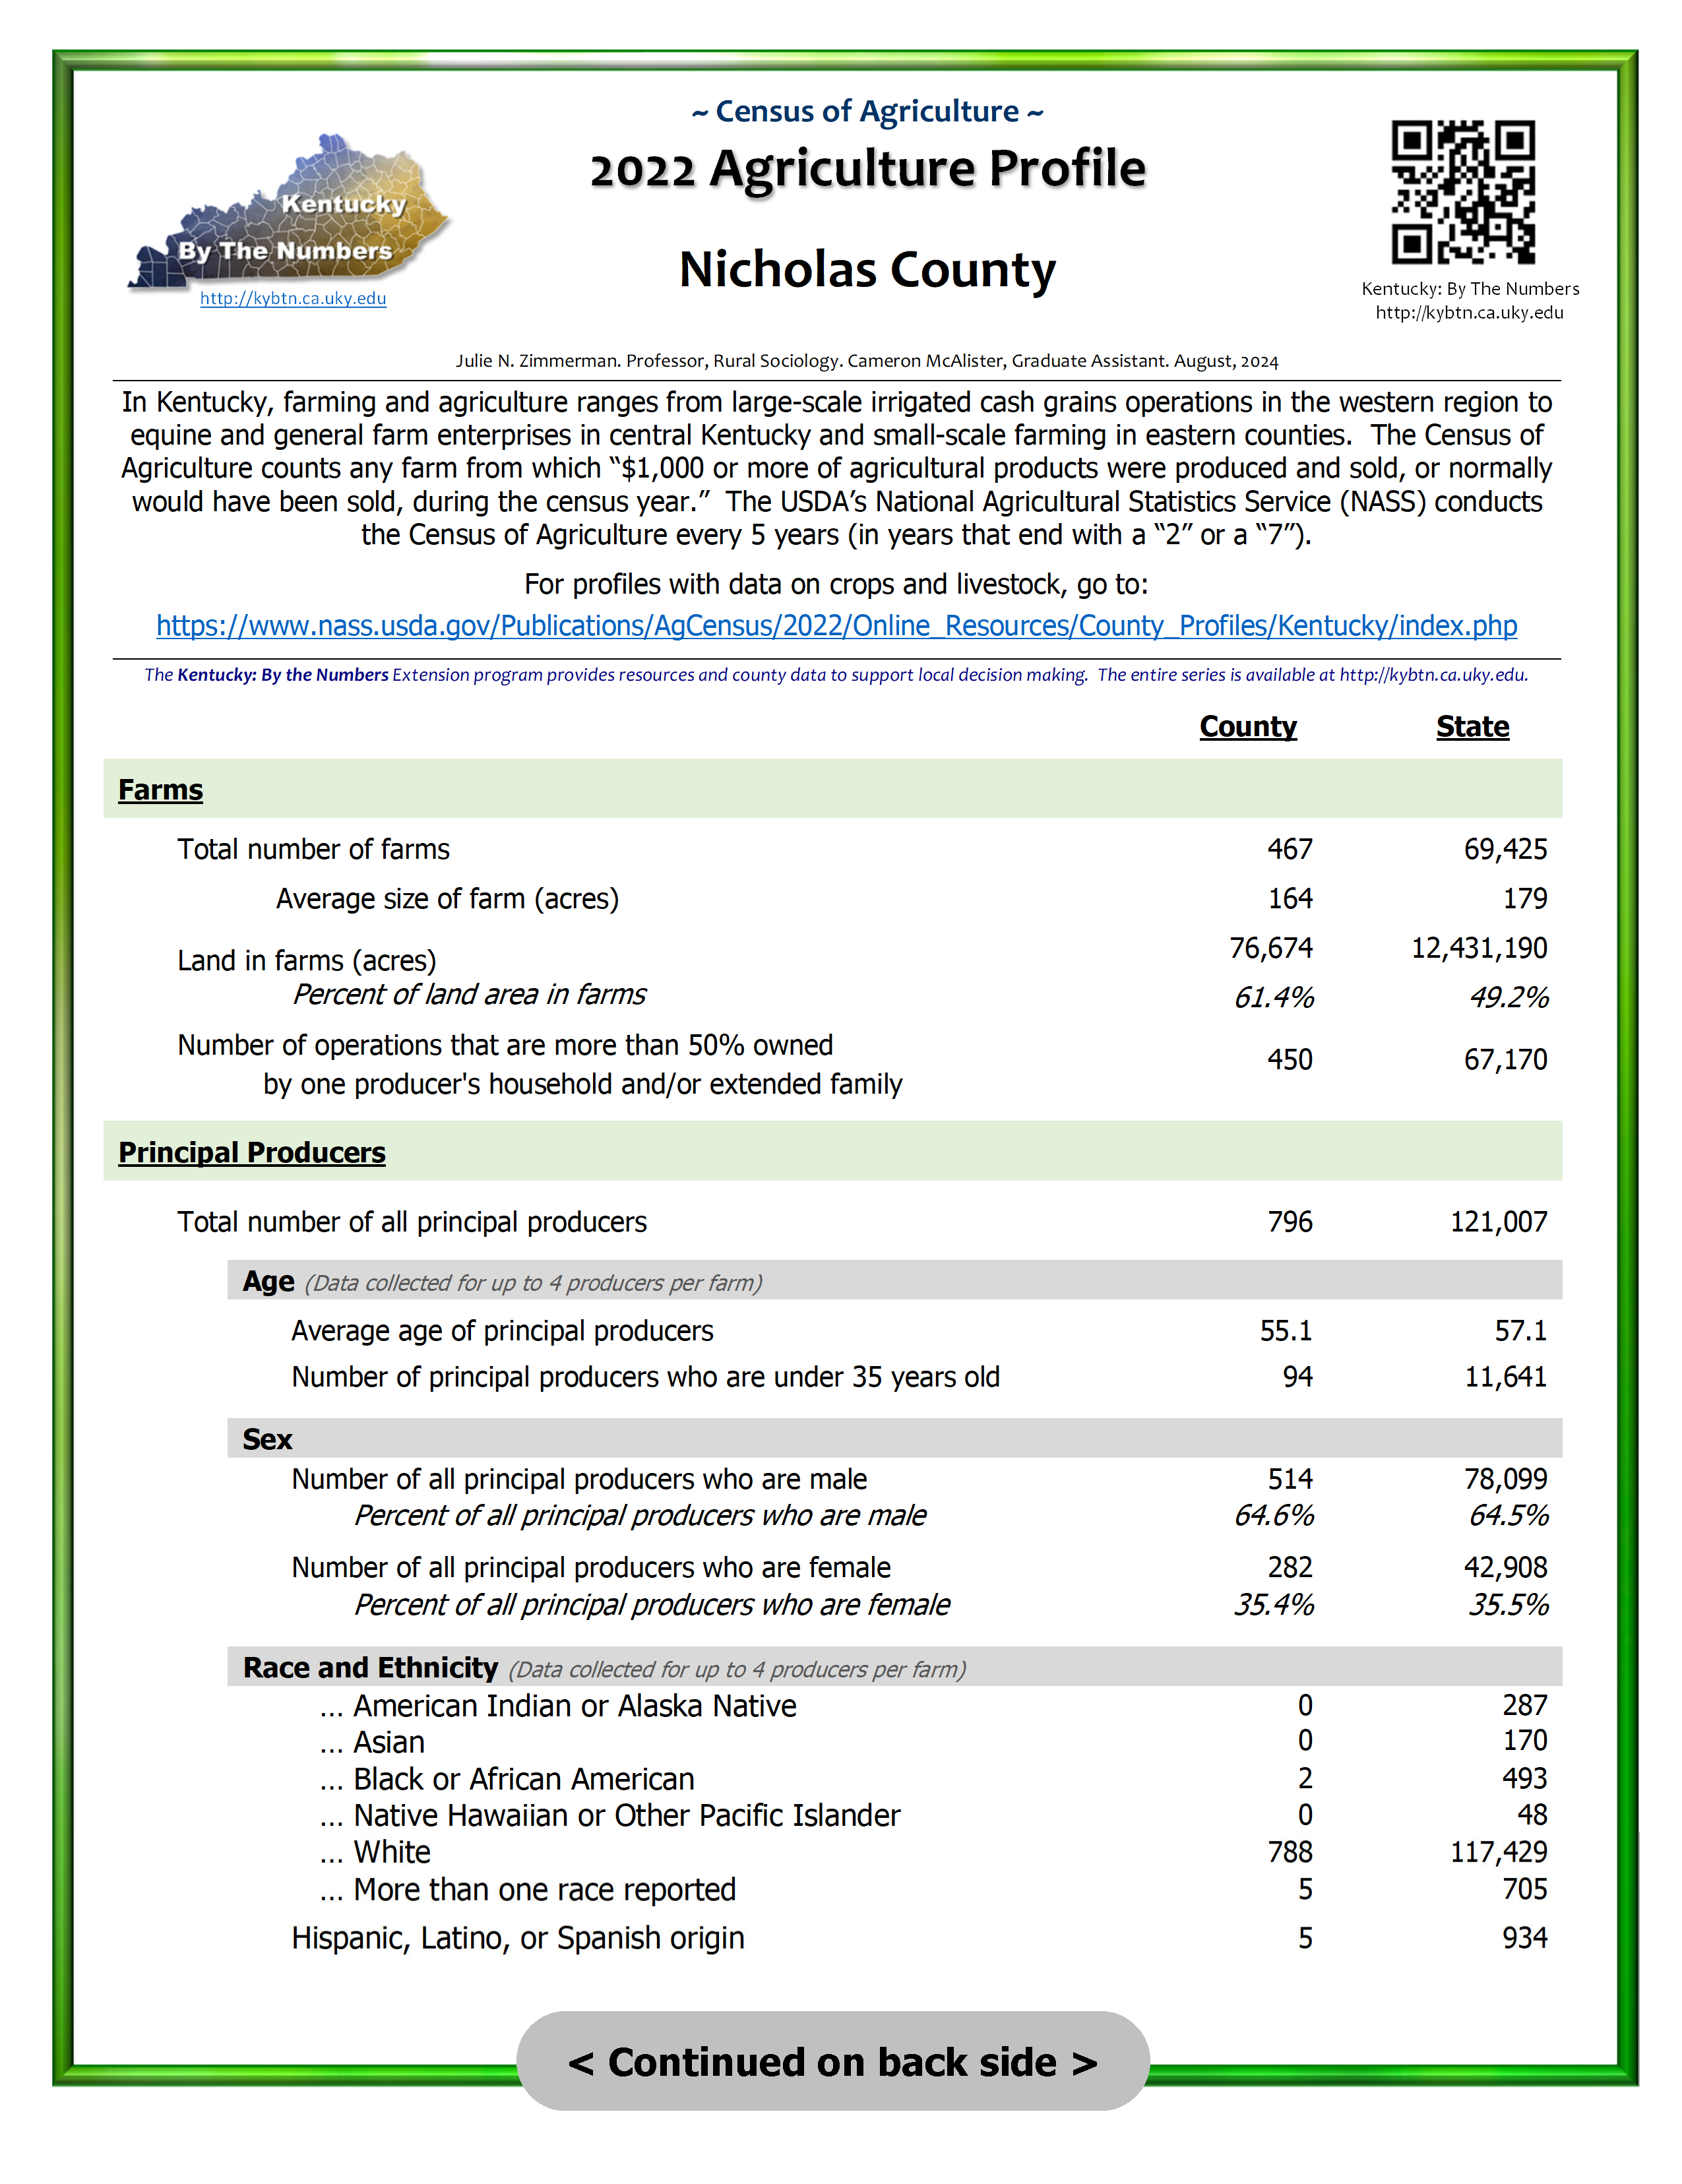 In Kentucky, farming and agriculture ranges from large-scale irrigated cash grains operations in the western region to equine and general farm enterprises in central Kentucky and small-scale farming in eastern counties. The Census of Agriculture counts any farm from which “$1,000 or more of agricultural products were produced and sold, or normally would have been sold, during the census year.” The USDA’s National Agricultural Statistics Service (NASS) conducts the Census of Agriculture every 5 years (in years that end with a “2” or a “7”).
Limited English-Speaking Individuals
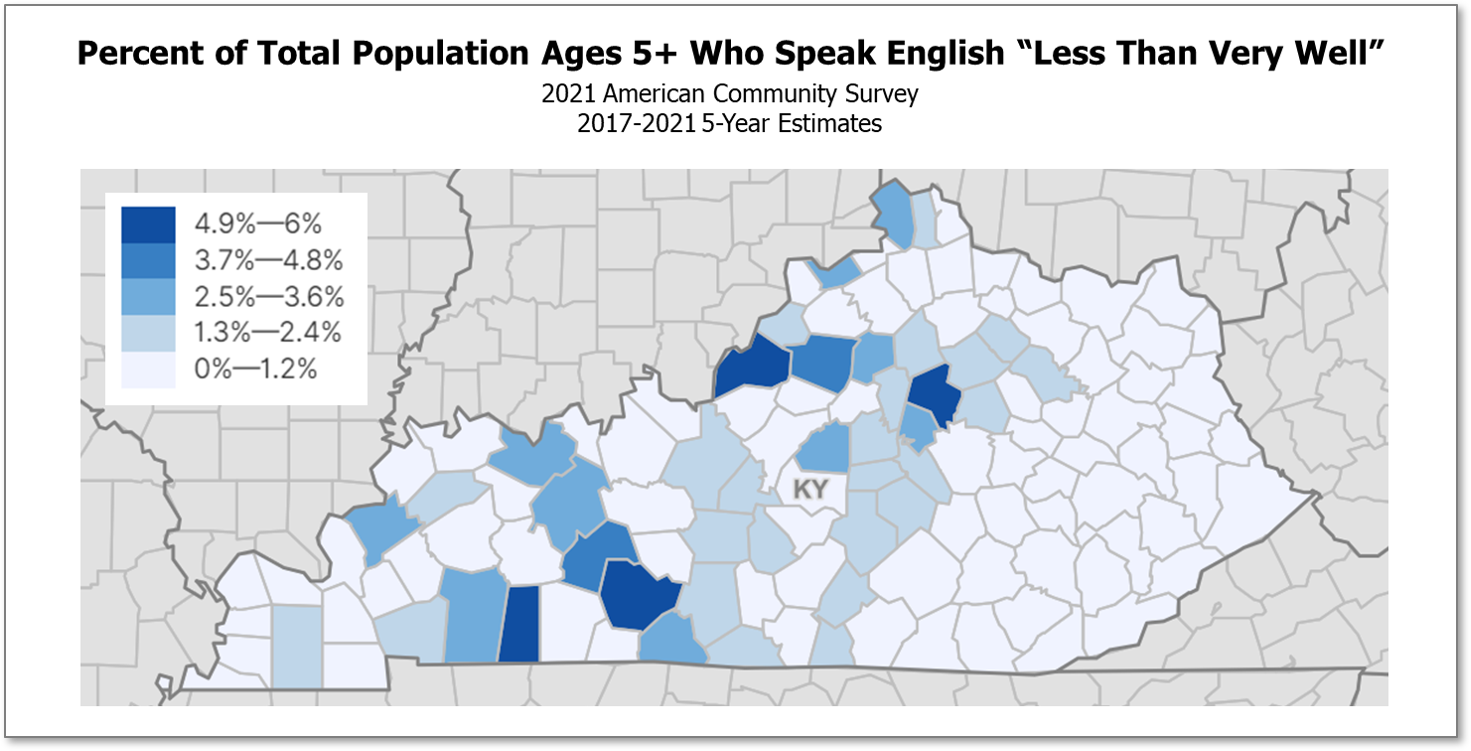 Even though most individuals in the U.S. speak English at home, there are many who speak other languages. In addition, while there are many people who speak another language and have no difficulty with English, there are still individuals who speak English “less then very well.” This issue of Kentucky: By The Numbers provides data on limited English-speaking individuals.
2024 County Profiles
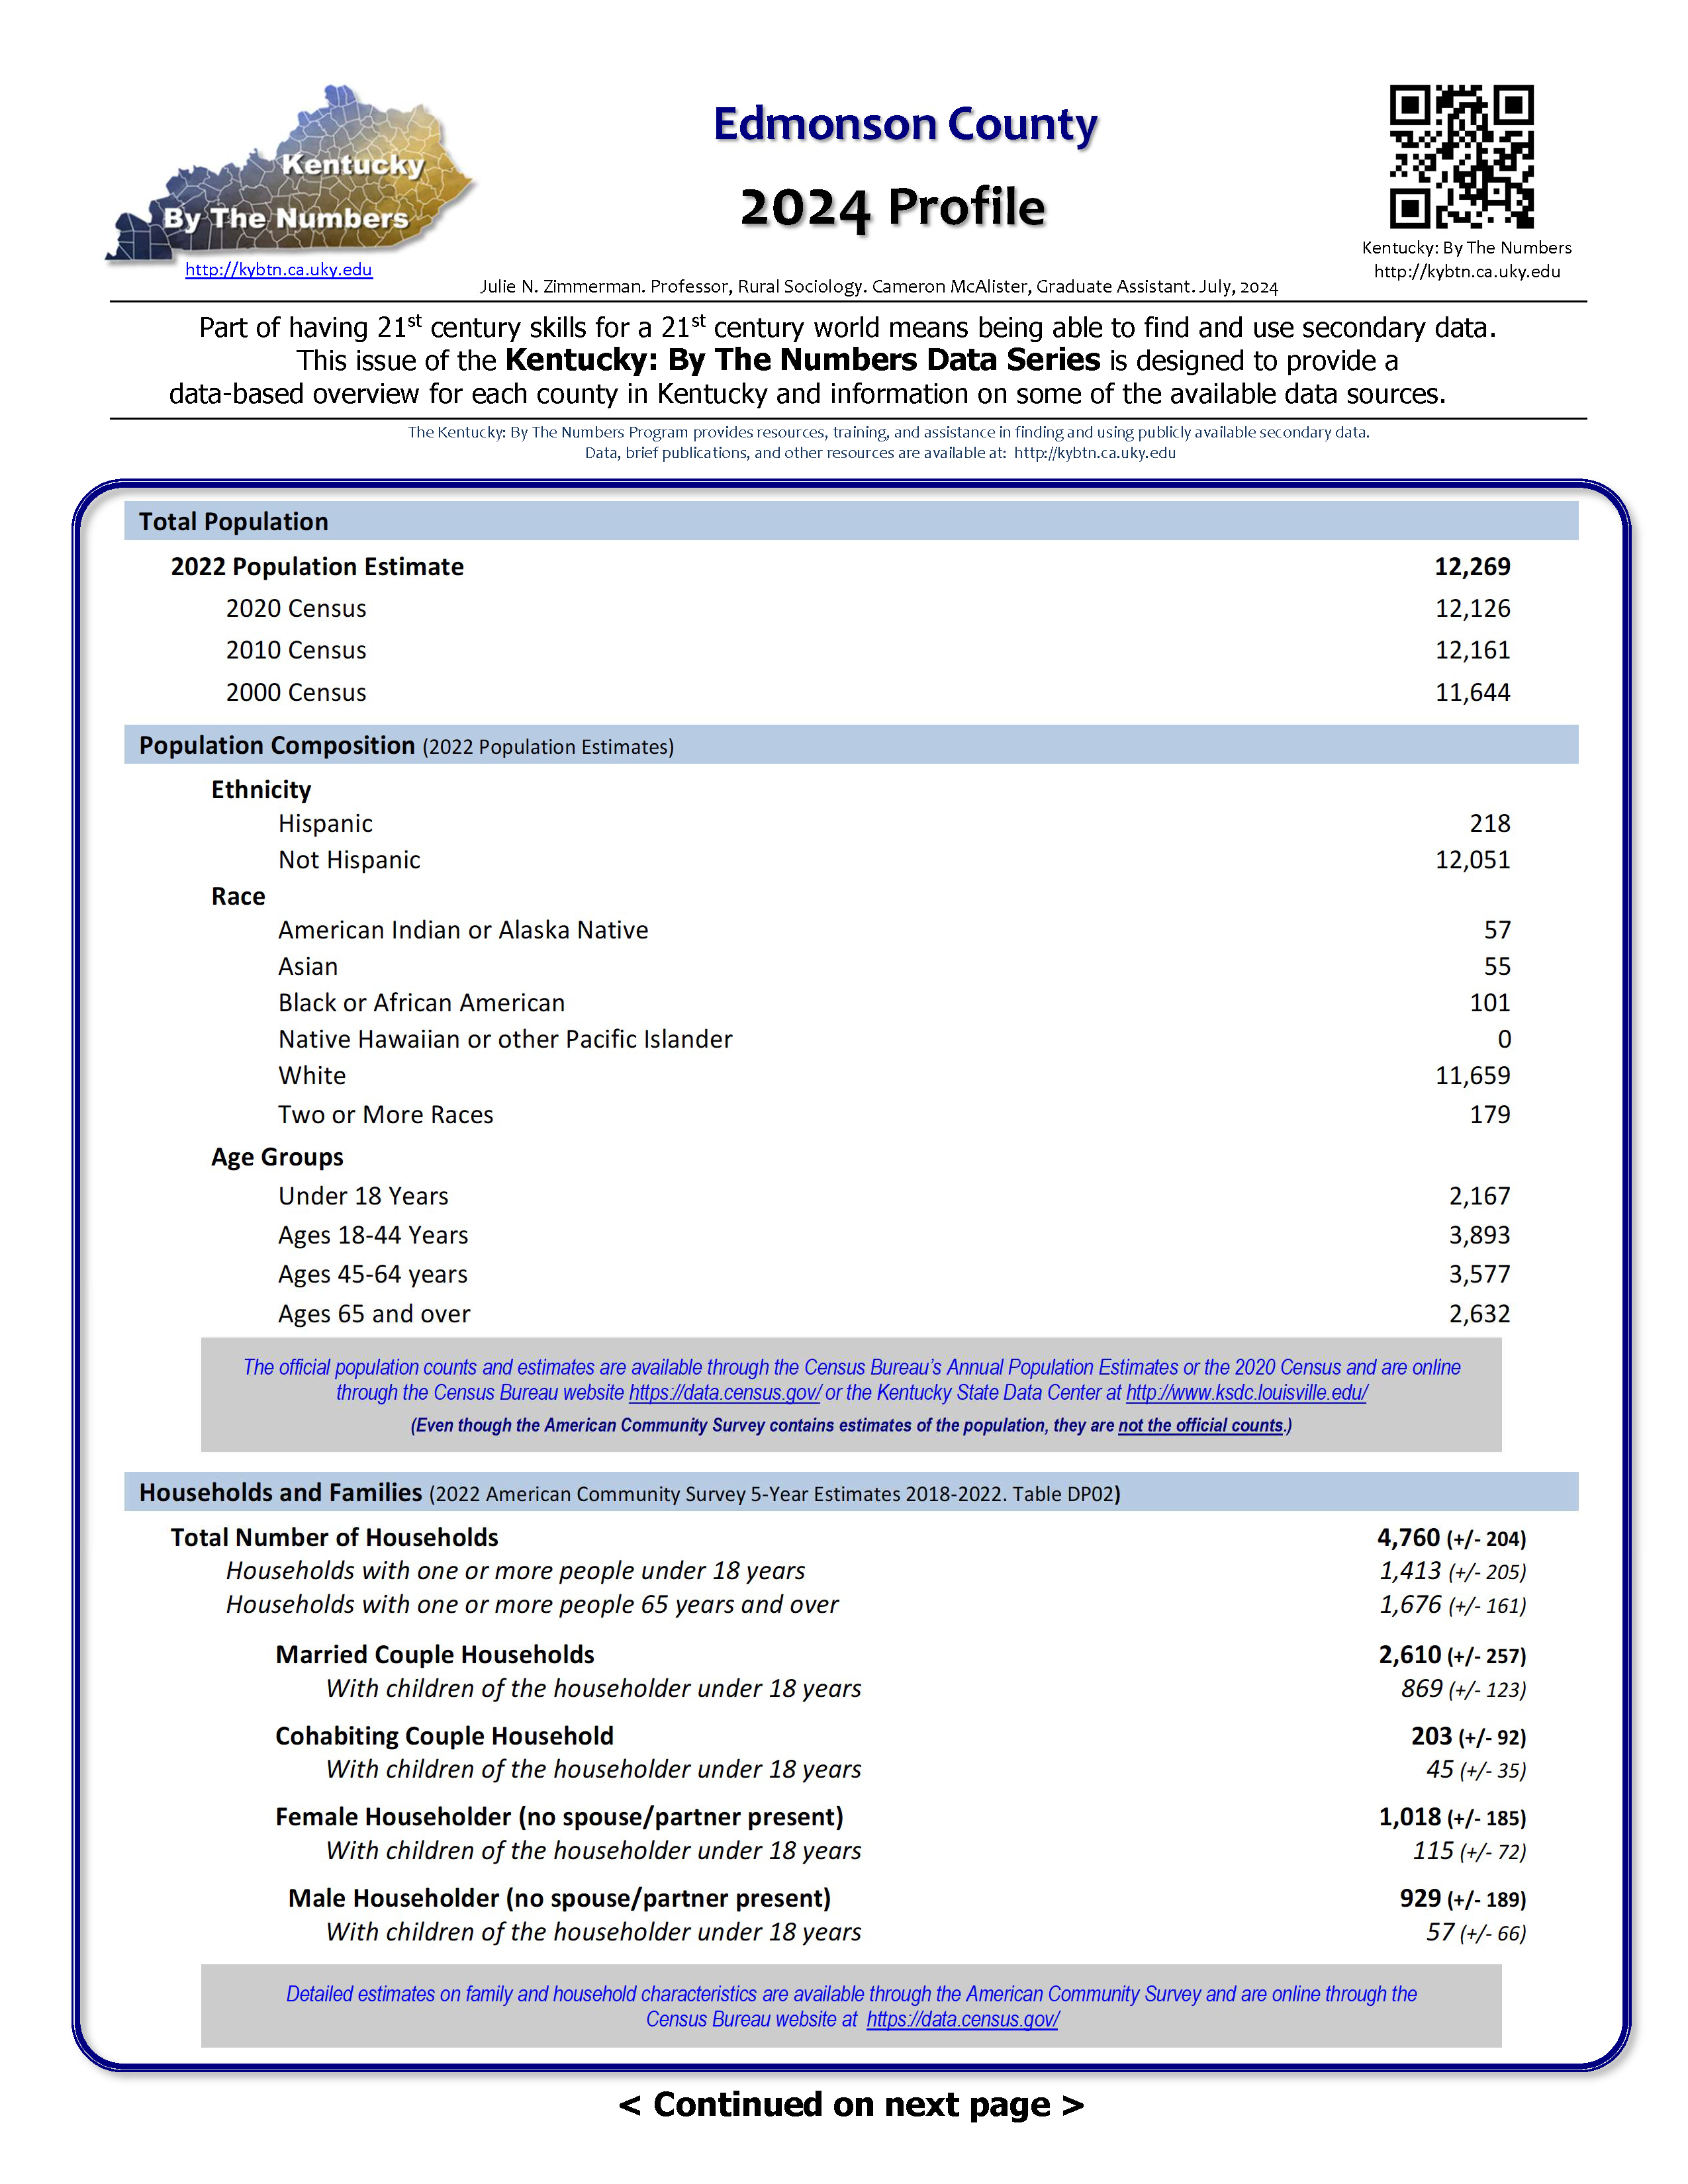 Part of having 21st century skills for a 21st century world means being able to find and use secondary data.
This issue of the Kentucky: By The Numbers Data Series is designed to provide a data-based overview for each county in Kentucky and information on some of the available data sources.
2020 Census Profile
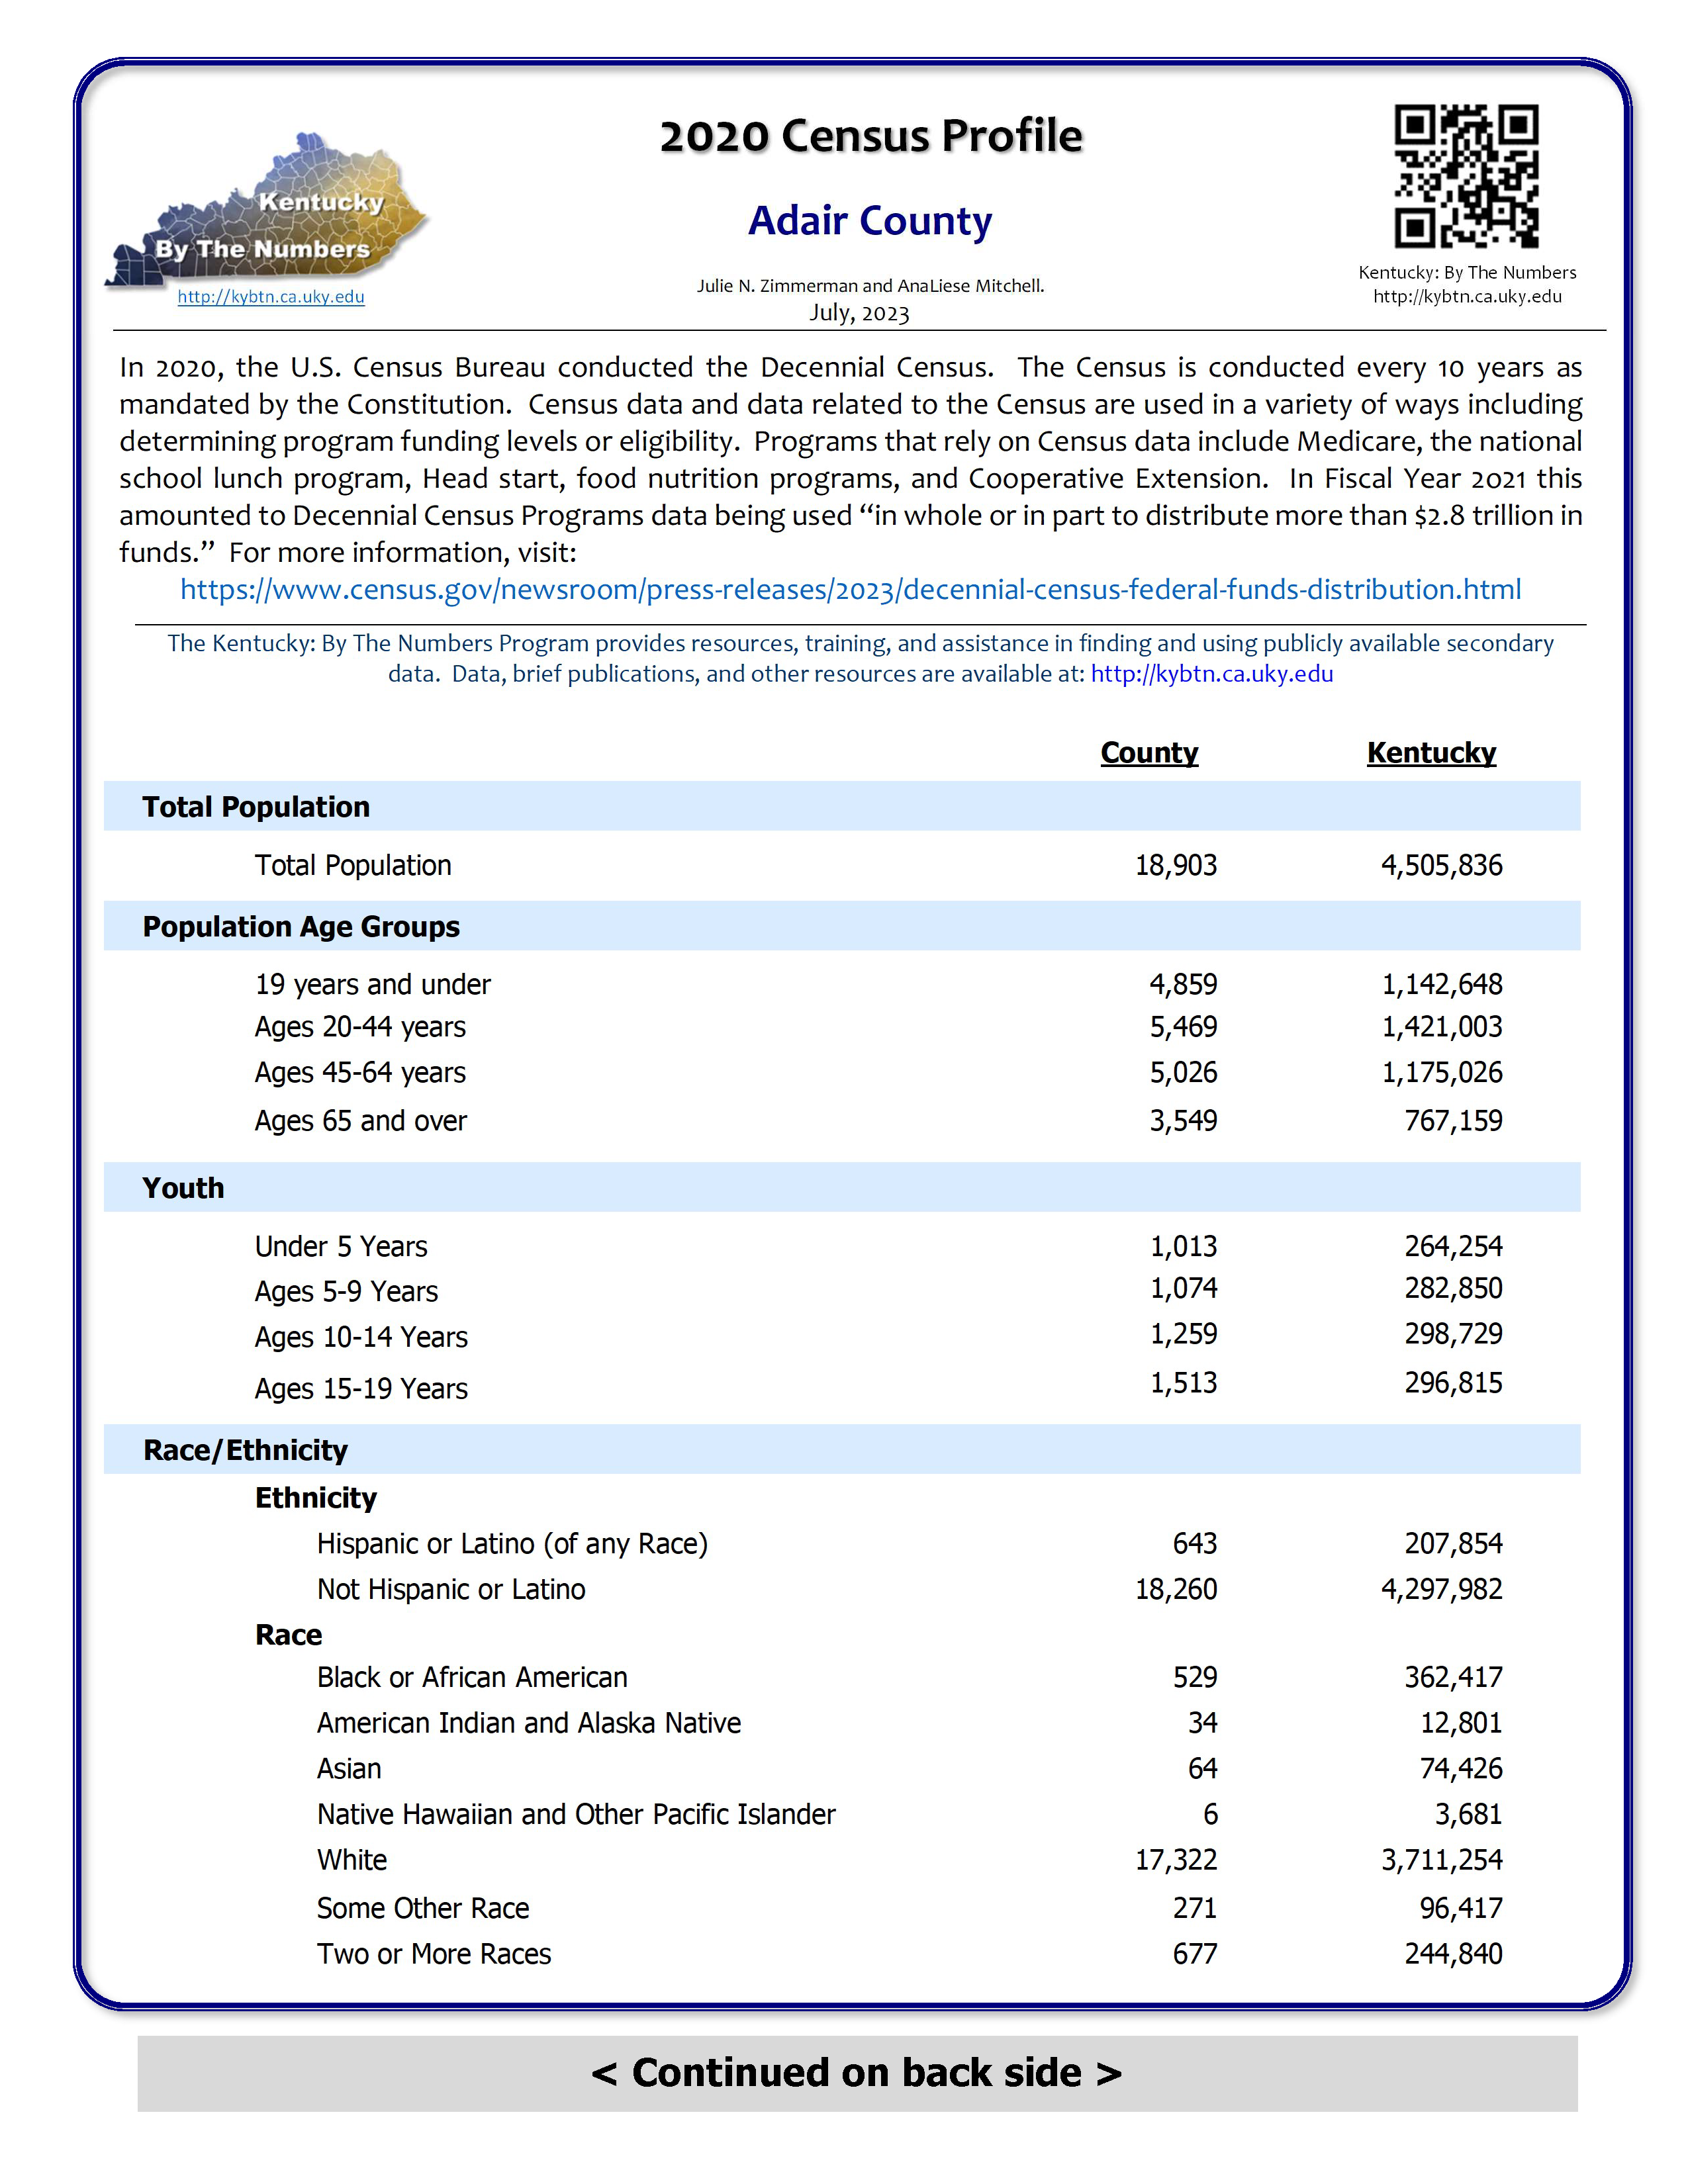
In 2020, the U.S. Census Bureau conducted the Decennial Census. The Census is conducted every 10 years as mandated by the Constitution. Census data and data related to the Census are used in a variety of ways including determining program funding levels or eligibility. This issue of Kentucky: By The Numbers provides an overview of some of the key data from the 2020 Census.
100 Years of Population
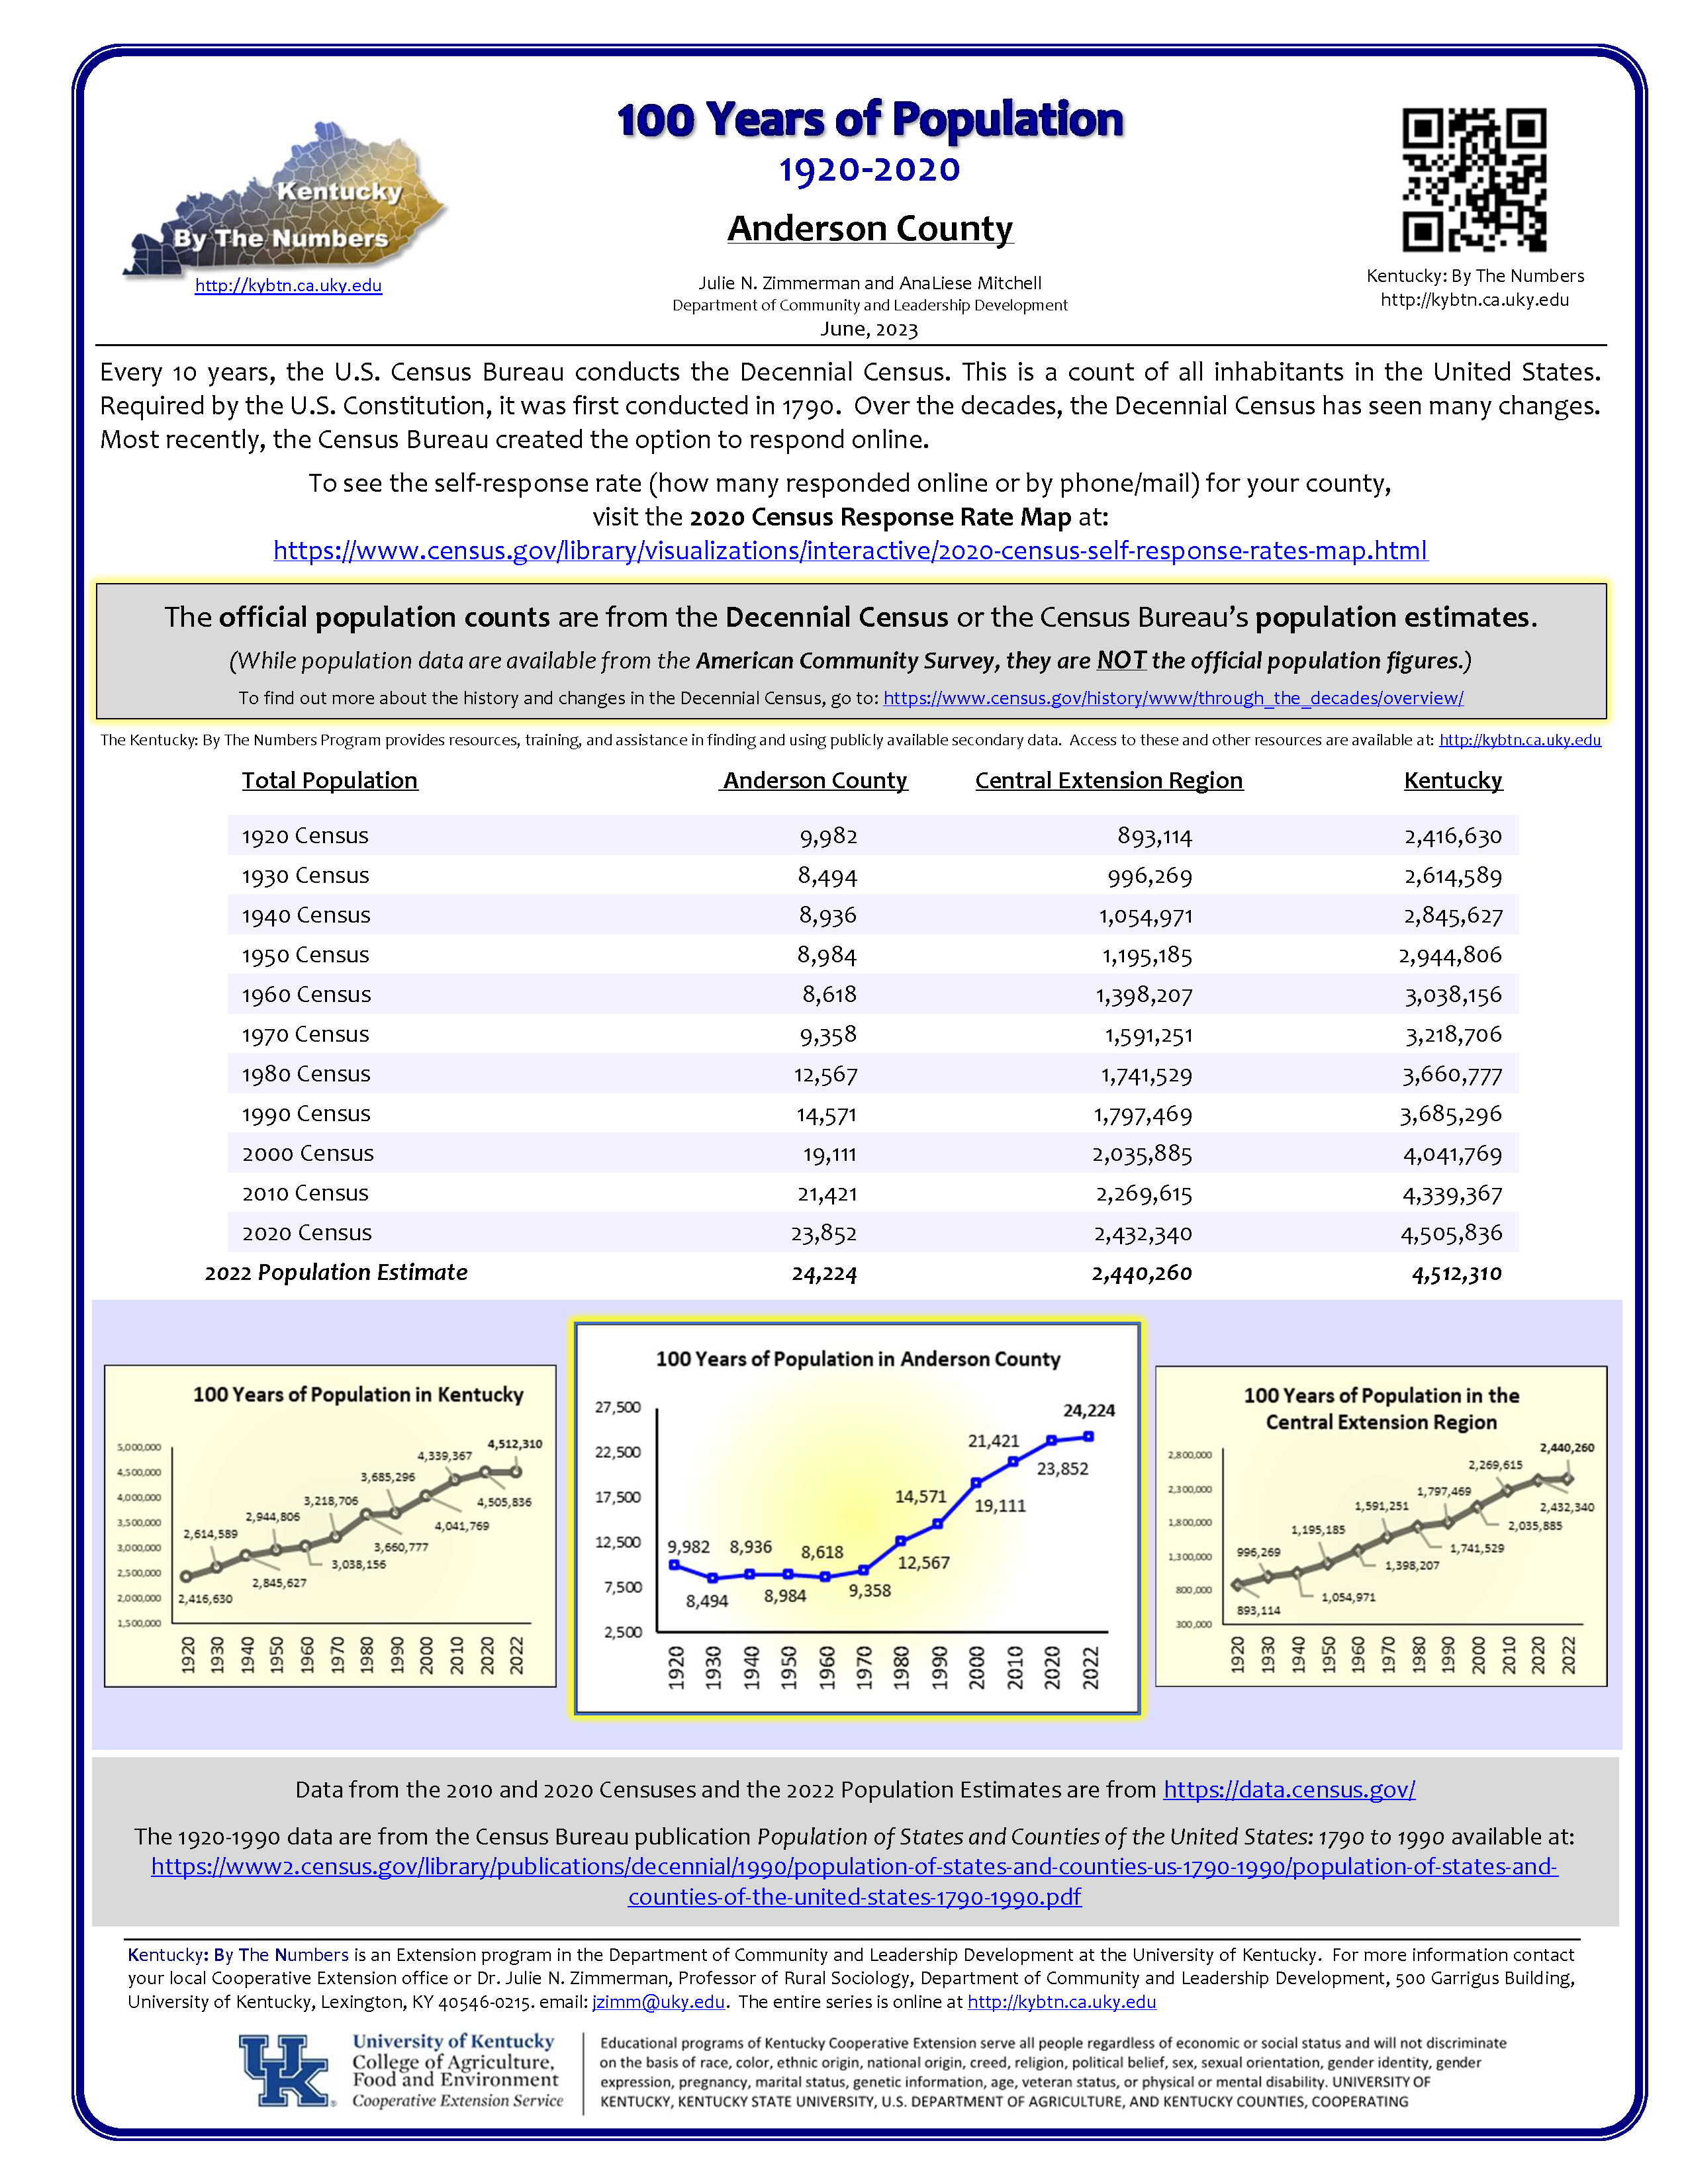
Every 10 years, the U.S. Census Bureau conducts the Decennial Census. This is a count of all inhabitants in the United States. Required by the U.S. Constitution, it was first conducted in 1790. Over the decades, the Decennial Census has seen many changes. Most recently, the Census Bureau created the option to respond online. This issue of Kentucky: By the Numbers provides data and line graphs of the last 100 years of population for each of Kentucky's 120 counties.
Limited English-Speaking Households
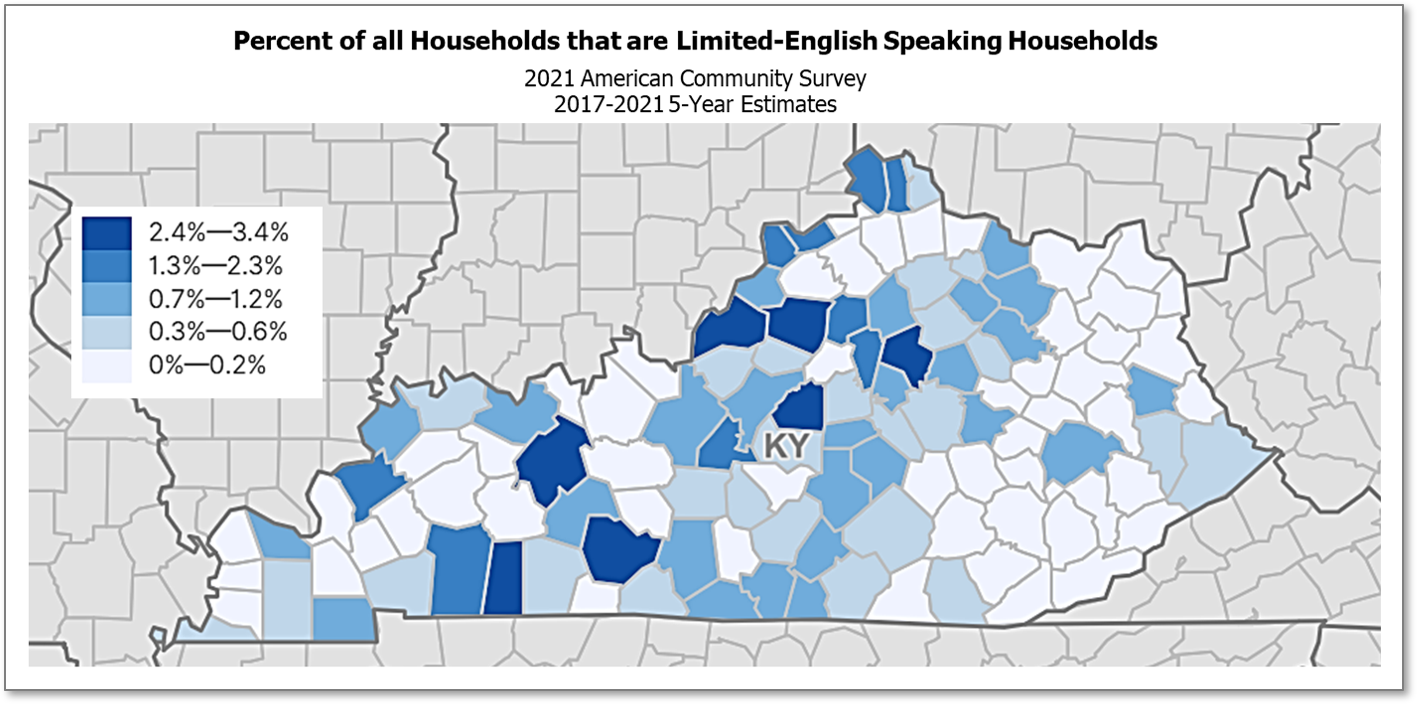
According to the 2021 American Community Survey, between 2017 and 2021, there were 24,306 (+/- 1,238) limited English-speaking households in Kentucky. This issue of Kentucky: By The Numbers provides county-level data on limited English-speaking households across the state.
________ and _________ Data Series
The population in Kentucky, like the nation overall, is growing more and more diverse. To help in understanding diversity in our communities and provide easy access to data, a multi-part series of Kentucky: By The Numbers was created to provide detailed data on race and ethnicity for counties in Kentucky and the state.
There are 4 issues in the original series: Race and Ethnicity, Race and Ethnicity Age Groups, Youth Race and Ethnicity, and Youth Race and Ethnicity over Time.
_______ and ________ Data Series Homepage
Youth Race and Ethnicity over Time
New additions
Limited English-Speaking Households
Limited English-Speaking Individuals
COVID-19 At Risk issue of Kentucky: By The Numbers
As we continue to learn about COVID-19, some individuals are at higher risk of experiencing severe illness, including older adults and people of any age who have underlying medical conditions. Data for each county on these and other groups have been brought together in a special issue of Kentucky: By The Numbers.
Mini posters available for each of the 3 new Extension Regions
A series of 11 x 17 mini posters were created to assist with Cooperative Extension’s transition to 3 Extension Regions. For each region, mini posters were created with maps of selected data. There are also mini posters with population data by region and by area within each region.
2017 Census of Agriculture profiles
Want to compare the results from the 2022 Census of Agriculture with the previous one?
Every 5 years the USDA's National Agricultural Statistical Service conducts the Census of Agriculture. This issue of Kentucky: By the Numbers provides data from the 2017 Ag Census including farm and producer/operator characteristics.
Eastern Kentucky by the Numbers profiles now available
![]()
Eastern Kentucky by the Numbers profiles were created in conjunction with the University of Kentucky's Appalachian Center. These profiles represent all 54 Appalachian Kentucky counties. Profiles cover 18 data sources and 10 different substantive areas, including agriculture, employment, and health.
Data on Families at Risk are available in a special profile
The Supporting Families at Risk profiles were originally developed as a special request from Family and Consumer Sciences agents in Grayson, Breckinridge and Meade counties to support their Tri County Family and Consumer Sciences Supporting Families at Risk Series.
Since these data could also be useful for others across the state, this special issue of Kentucky: By The Numbers provides the same data for each of the 120 counties. Data elements include grandparents raising grandchildren, out-of-home care, neglect and abuse, substance abuse, and crime including domestic abuse, violent crime, and drug arrests.
"About Kentucky: By The Numbers"
Ever wondered how the Kentucky: By The Numbers Program got started? A background and history about the program has been added to the website. Just click on About "Kentucky: By The Numbers" to learn more.
To learn more about Dr. Julie N. Zimmerman, you can visit her CLD Department webpage or watch her video in the "Get to Know UK CLD Extension Faculty."
